Using NodeRed and Grafana to log Gateway coverage
Using ttnmapper to map nodes is often good start for mapping.
But ttnmapper is still closed source and you can only use it for showing coverage of TTN gateways.
If you have your own infrastructure you need some other way to visualize your GPS data.
So first you need to have your data received in NODE-RED and I will not write here about that.
You can get data from TTN or from your own loraserver.
So now that you have your data arriving you need to setup few nodes.
But first you need to install support on your server
To install install worldmap node use npm
cd ~

cd .node-red

npm install node-red-contrib-web-worldmap
After installing restart your node red and you should be able to see worldmap in your browser
http://server:1880/worldmap
If you do not have it already – you will need to install grafana and influxdb support
To get data into right format we need two more things
geohash
cd ~

cd .node-red

npm install node-red-node-geohash
and Grafana plugin
cd ~

grafana-cli plugins install grafana-worldmap-panel

/etc/init.d/grafana-server restart
Now you need to create database in infux
from console on your server you can just:
influx
>CREATE DATABASE gps
>exit
Now we have all installed and ready for our data
Go to node-red
and create nodes like this
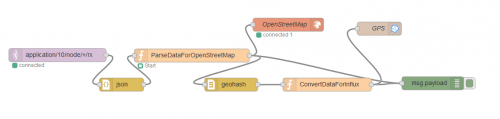
here is code for function nodes
ParseDataForOpenstreetMap should look like this
node.status({fill:"green",shape:"ring",text:"Start"});
var hex = msg.payload.data.toString();
var raw = new Buffer(hex, 'base64');
if (raw[0]==0x01 && raw[1]==0x88){
var latitude = (raw[2] <<16 | raw[3] << 8 | raw[4]); var longitude = (raw[5] <<16 | raw[6] << 8 | raw[7]); var latiFloat = 0.0000; var longFloat = 0.0000; latiFloat = latitude / 10000; longFloat = longitude / 10000; var altitudeGps = (parseInt(raw[8] <<16 | raw[9] << 8 | raw[10],16))/1000; var gpsNodeName = msg.payload.nodeName; var color = "green"; //ako je potvrda na ack paint blue if(raw[0] == 1 || raw[0] == 49) { node.status({fill:"red",shape:"dot",text:"ACK!" }); color = "blue"; } //msg.payload.nodeName msg.payload = { name: msg.payload.nodeName, icon:"car", iconColor: color, zoom:15, rssi: msg.payload.rxInfo[0].rssi, snr: msg.payload.rxInfo[0].loRaSNR, frequency: msg.payload.txInfo.frequency, spreadFactor: msg.payload.txInfo.dataRate.spreadFactor, fCnt: msg.payload.fCnt, fPort: msg.payload.fPort, data: msg.payload.data, gateway: msg.payload.rxInfo[0].name, rawData: raw, applicationID: msg.payload.applicationID, applicationName: msg.payload.applicationName, nodeName: msg.payload.nodeName, mac: msg.payload.nodeName, devEUI: msg.payload.devEUI, lat: latiFloat, lon: longFloat, alt: altitudeGps }; return msg; }
Second function ConvertDataforInflux is:
color = "blue";
msg.payload = [
[{
icon:"car",
iconColor: color,
zoom:15,
rssi: msg.payload.rssi,
snr: msg.payload.snr,
frequency: msg.payload.frequency,
spreadFactor: msg.payload.spreadFactor,
fCnt: msg.payload.fCnt,
fPort: msg.payload.fPort,
data: msg.payload.data,
lat: msg.payload.lat,
lon: msg.payload.lon,
alt: msg.payload.alt,
geohash: msg.payload.geohash
},
{
applicationID: msg.payload.applicationID,
applicationName: msg.payload.applicationName,
nodeName: msg.payload.nodeName,
mac: msg.payload.mac,
devEUI: msg.payload.devEUI,
gateway: msg.payload.gateway
}]
];
return msg;
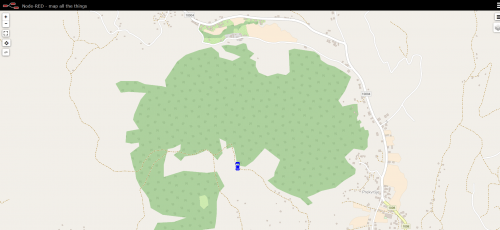
Now you can start your GPS node and check is a CAR icon visible on map
http://server:1880/worldmap
If you see the car next is to check is influx logging data
>USE gps

>select * from logs
If you see some data move to next level - Grafana
Again I will not write whole thing - you need to add influx datasource by yourself
Next create dashboard and create TABLE first and go to edit mode it will be useful to see actual data...
Remove example data
Chose panel data source - your gps influx data and click add query
On right you need to click on toggle edit mode and paste QUERY
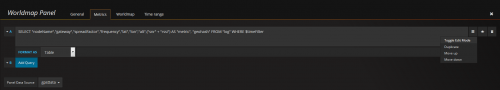
SELECT "nodeName","gateway","spreadFactor","frequency","lat","lon","alt",("snr" + "rssi") AS "metric", "geohash" FROM "log" WHERE $timeFilter
Set FORMAT AS Table
and you should see all your logs now
GO back to dashboard, and now add WorldMap
Do the same as for table
Go to WorldMap settings and set your starting location and coloring...
Set Map Data Options as shown
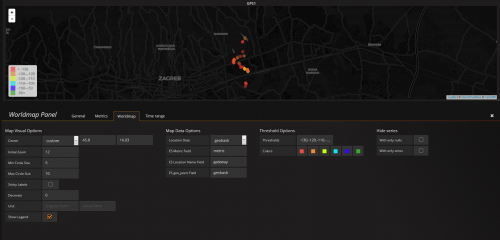
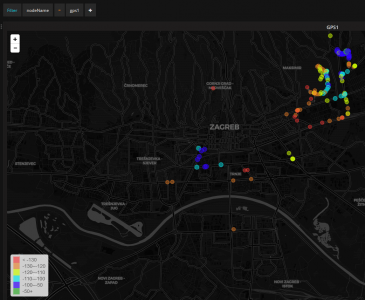
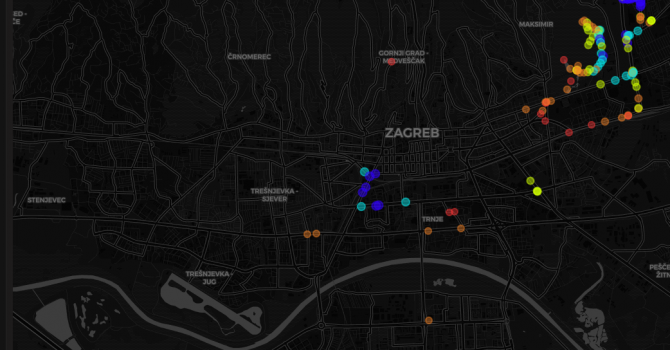
Now you should be able to see all your points on map.
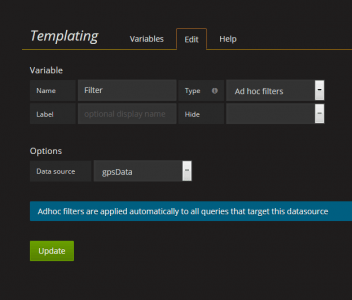
Last thing we want is to setup FILTER
So go to Templating and set it like this
And that is it you should have nice coverage map :)